Document Type : Research Paper
1. Introduction:
Water quality is a major environmental concern in the world, especially in areas undergoing rapid industrialization and urbanization. Rivers near industrial centres are particularly susceptible to untreated or partially treated effluents, which can carry a wide range of pollutants including organic substances, hydrocarbons nutrients and trace elements that may be toxic. These pollutants can make certain changes in physicochemical context of the aquatic ecosystem, disturb the ecological equilibrium, and may also create risks for human health via drinking water or bioaccumulation [1]. Industrial applications of energy production and refining of petroleum are acknowledged to be significant contributors to aquatic pollution. A variety of waste streams are produced from power and oil refineries, which may include heavy metals, oil emulsions, suspended solids, and chemical additives. Untreated or unmonitored discharges of these wastes into riverine systems may create long-term environmental problems and produce contaminated sediments [2].
Metal pollutants in natural water are now significantly due to anthropogenic inputs and rapid urbanization [3]. Naturally, the dumping of diverse chemicals into natural water has contaminated them worldwide, which is also a worrisome and sensitive issue, especially in the case of uneven rainfall patterns along with resource crunch [4]. Relevant Concerns Raised by Trace Elements as the Generally Widespread Contaminants Involving Their Toxicity and potential to accumulate in sediments, aquatic systems, and living organisms, trace elements are ubiquitous contaminantsposing several concerns. The quality of the water supplied is determined by its intended use [5]. The Tigris River is the main source of freshwater in central Iraq and supports domestic, agricultural, and environmental uses. In southern Baghdad, the river receives several anthropogenic impacts in terms of discharges from industrial plants such as Al-Dora refinery and power plants located in the vicinity. Although this river section is strategically important, there are still few assessments on the impact of industrial waste on its water quality [6], [7]. This research aims to assess the environmental impact of waste generated by the power plant and the Al-Dora refinery on the water quality of Tigris River south of Baghdad, by analyzing the physical and chemical properties and major pollutants, and comparing the measured values with approved environmental international standards to determine the level of pollution and the extent of the impact of industrial activities on the water system.
2. Materials and Methods:
2.1 Study Area:
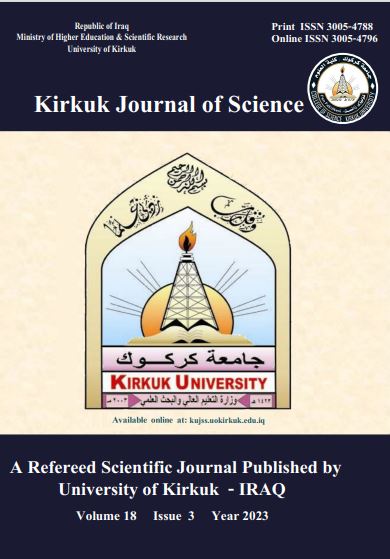
Four locations were selected from the southern part of Tigris River within the city of Baghdad City (Figure 1 and Table 1), where several vital facilities are located, such as AlDora power station and the Al-Dora refinery. Water samples were collected over a period of nine months, at a rate of one sample per month, from October 2024 to June 2025.

Figure 1. Map of current study locations (Google Maps)
Table 1. Geographical locations of the modeling sites for the current study.
|
Sites |
Longitude (east) |
Latitude (North) |
||||
|
° |
' |
" |
° |
' |
" |
|
|
1 (Al-Jadriya Bridge) |
44 |
21 |
59 |
33 |
16 |
26 |
|
2 (Al-Dora Power Station) |
44 |
22 |
41 |
33 |
15 |
45 |
|
3 (Two-story bridge) |
44 |
24 |
15 |
33 |
16 |
43 |
|
4 (New Baghdad Bridge) |
44 |
26 |
41 |
33 |
17 |
15 |
2.2 Water Samples:
Samples were obtained from the surface water layer at a depth of 30 cm using a polyethylene bucket, and the samples were transported for laboratory testing.
2.3 Physicochemical Parameters:
The temperature was also measured using mercury thermometers at each study site, and the average readings were taken. Electrical conductivity was measured using a conductive meter in the laboratory, and the results are expressed in µS/cm. Total dissolved solids (TDS) were measured in the laboratory using the method of [8]. The pH of the water at the studied locations was measured using a digital portable pH meter, model pH90, by [9]. Chloride (Cl) was determined using the method described in [10]. Sulphate (SO4-2) was measured using the method of [11] using graphitography. Dissolved oxygen was measured using the standard Winkler method described by [12]. Biological oxygen demand (BOD5) was measured using the method described by the American Public Health Association (APHA). Turbidity (2005): An American-made Motte 2020 measuring device was used. Phosphate (PO4-3): The method of [13], described by [14], was followed. Nitrite (NO2): The method of [15], modified by Strickland and Parsons, described by (Parsons et al., 1984), was used. Nitrite (NO3-): The method of (1952) Bendschneider and Robinson, described by (Parsons et al., 1984), was used. Heavy Metals: Heavy metals in water samples were measured according to the method described in [16], using an atomic absorption spectrometer. Preservative Solutions: Lugol’s solution was used.
2.4 Water Quality Index (WQI):
The Canadian Water Quality Index was calculated based on physical and chemical tests, taking into account values exceeding local and international limits and the number of samples collected at the site, as calculated in Equation 1.
WQI = 100−√ F1+F2+F3/1.732 .....(1)
Where, F1 = (Number of factors exceeding standard limits according to World Health Organization (WHO)/ Total number of factors measured) x 100, F2 = (Number of readings exceeding standard limits / Total number of factors measured) x 100, F3 = Sum of deviations / (0.01 x Sum of deviations) - 0.01.
2.5 Statistical Analysis:
The Statistical Packages of the Social Sciences (SPSS) software (2019) was used to analyze the data to study the effect of location and season on the studied variables. Significant differences between means were compared using the Least Significant Difference (LSD) test, and the correlation coefficient (r) was estimated between the fungi and the other variables.
3. Results and Discussion:
Table 2 shows the physicochemical properties of the water at S1 and compares them to the permissible limits. Water temperatures (WT) ranged between 12 and 20 oC throughout the different seasons, being above the standard value during autumn and summer (20 oC) and below it in winter and spring, reflecting the direct influence of seasonal climatic variations. Turbidity (Tur.) exceeded the permissible limit (5 NTU) in all seasons except summer, indicating a high content of fine suspended solids, especially during autumn and spring. Electrical conductivity (EC) values were high during the summer (1160 µS cm−1), exceeding the standard limit (1000 µS cm−1). Total dissolved solids (TDS) and total suspended solids (TSS) values also exceeded the permissible limits during some seasons, particularly summer, compared to the standard values of 500 and 25 mg L−1, respectively. Dissolved oxygen (DO) values remained within the permissible limits (5.5–9 mg L−1) in all seasons, indicating relatively favorable oxygen conditions. The biological oxygen demand (BOD) exceeded the permissible limit (5 mg L−1) during the autumn and spring seasons. pH values showed a moderate range between 7.27 and 8.1, all within the permissible limits (6.5–9). In contrast, total alkalinity (TA) recorded its highest value during winter (728 mg CaCO.L−1), exceeding the permissible standard limit (200 mg CaCO.L−1), while remaining within the permissible limits in the other seasons. Sulfate (SO42−), nitrate (NO3), and silica (SiO2) concentrations remained within acceptable limits throughout all seasons.
Table 2. Results of physicochemical water properties at site 1
|
Variable |
Autumn |
Winter |
Spring |
Summer |
Standard Value (Sn) |
|
WT ( Cᵒ ) |
20 |
12.5 |
12 |
20 |
15 |
|
Tur. ( NTU ) |
9.5 |
8.25 |
8.6 |
5.1 |
5 |
|
EC ( µ.s . cm-1) |
830 |
788 |
826 |
1160 |
1000 |
|
TDS ( mg .L-1) |
416 |
393.5 |
416.5 |
567 |
500 |
|
Tss ( mg .L-1) |
27 |
22 |
22 |
19 |
25 |
|
DO ( mg .L-1) |
5.8 |
8.45 |
6.65 |
6.7 |
5.5 - 9 |
|
BOD ( mg .L-1) |
8.95 |
4.5 |
9.95 |
4.9 |
5 |
|
pH |
7.6 |
8.1 |
7.86 |
7.27 |
6.5 – 8.5 |
|
TA ( mg. CaCO3 . L-1) |
152 |
728 |
108 |
138 |
200 |
|
SO4 ( mg .L-1) |
177.5 |
160 |
152.5 |
190 |
250 |
|
NO3 ( mg .L-1) |
0.3 |
0.28 |
1.28 |
0.53 |
13 |
|
PO4 ( mg .L-1) |
0.62 |
0.78 |
0.325 |
0.41 |
0.1 |
|
TH ( mg .L-1) |
327.5 |
333.5 |
400 |
370 |
120 |
|
SiO2 ( mg .L-1) |
6.1 |
4.16 |
5.12 |
2.8 |
10 |
|
Pb ( mg .L-1) |
0.17 |
0.165 |
0.085 |
0.11 |
0.003 |
|
Cd ( mg .L-1) |
0.026 |
0.025 |
0.019 |
0 |
0.002 |
|
Cu ( mg .L-1) |
0.945 |
0.295 |
0.43 |
0.09 |
0.003 |
|
Zn ( mg .L-1) |
1.97 |
0.68 |
1.74 |
0.41 |
0.03 |
Phosphate (PO43−) also exceeded the allowable limit (0.1 mg L−1) in all seasons and total hardness (TH) was still relatively higher in all seasons than the permissible level (120 mg L−1). Heavy metal levels in water. The concentration of lead (Pb), cadmium (Cd), copper (Cu), and zinc (Zn) was also above most standard values allowable within each season, especially in fall and winter, showing similar cases for high mineral pollution due to factory activities. The results of physicochemical water properties at S2 are presented in Table 3. WT ranged from 12.5 oC during winter to 20 oC in both autumn and summer, exceeding the standard value (15 oC) in autumn and summer. Turbidity values varied between 5.9 and 9.5 NTU and exceeded the standard value (5 NTU) in all seasons. EC values ranged from 780 to 1150 µS cm−1, exceeding the permissible limit (1000 µS cm−1) during the summer season. TDS ranged from 376 to 575 mg L−1and exceeded the standard limit (500 mg L−1) during summer, while remaining below the limit in other seasons. TSS values ranged from 34 to 53.5 mg L−1and exceeded the permissible limit (25 mg L−1) throughout all seasons. DO ranged from 4.8 to 7.25 mg L−1 and fell below the permissible range (5.5–9 mg L−1) during summer, while remaining within the standard range in other seasons. BOD values ranged from 7.85 to 11.7 mg L−1and exceeded the standard limit (5 mg L−1) in all seasons. The pH values varied between 7.055 and 7.74 across all seasons and remained within the permissible range (6.5–8.5). TA values ranged from 129.5 to 177.9 mg CaCO3 L −1 and were within the standard limit (200 mg CaCO3 L −1) during all seasons Sulfate (SO4 2−) levels ranged from 167.5 to 198 mg L−1, nitrate (NO3−) ranged from 0.95 to 3.57 mg L−1, and silica (SiO2) ranged from 3.87 to 5.82 mg L−1; all remained within the permissible limits. Phosphate (PO43−) levels ranged from 0.58 to 0.88 mg L−1 and exceeded the standard value (0.1 mg L−1) during all seasons.
Table 3. Results of physicochemical water properties at site 2.
|
Variable |
Autumn |
winter |
spring |
summer |
Standard Value (Sn) |
|
WT ( Cᵒ ) |
20 |
12.5 |
14.15 |
20 |
15 |
|
Tur. ( NTU ) |
6 |
8.2 |
9.5 |
5.9 |
5 |
|
EC ( µ.s . cm-1) |
848 |
807.5 |
780 |
1150 |
1000 |
|
TDS ( mg .L-1) |
423.5 |
410.5 |
376 |
575 |
500 |
|
Tss ( mg .L-1) |
53.5 |
41 |
34 |
37 |
25 |
|
DO ( mg .L-1) |
5.75 |
7.25 |
5.7 |
4.8 |
5.5 - 9 |
|
BOD ( mg .L-1) |
11.7 |
7.85 |
8.8 |
7.9 |
5 |
|
pH |
7.055 |
7.7 |
7.11 |
7.74 |
6.5 – 8.5 |
|
TA ( mg. CaCO3 . L1) |
177.9 |
147 |
129.5 |
145 |
200 |
|
SO4 ( mg .L-1) |
183.5 |
169 |
167.5 |
198 |
250 |
|
NO3 ( mg .L-1) |
0.95 |
1.2 |
3.57 |
1.91 |
13 |
|
PO4 ( mg .L-1) |
0.595 |
0.88 |
0.795 |
0.58 |
0.1 |
|
TH ( mg .L-1) |
343 |
350 |
400 |
405 |
120 |
|
SiO2 ( mg .L-1) |
5.45 |
4.35 |
5.82 |
3.87 |
10 |
|
Pb ( mg .L-1) |
0.145 |
0.38 |
0.106 |
0.35 |
0.003 |
|
Cd ( mg .L-1) |
0.065 |
0.04 |
0.025 |
0.03 |
0.002 |
|
Cu ( mg .L-1) |
0.57 |
0.375 |
0.545 |
0.12 |
0.003 |
|
Zn ( mg .L-1) |
1.76 |
0.72 |
1.06 |
0.83 |
0.03 |
TH values ranged from 343 to 405 mg L−1 and exceeded the permissible limit (120 mg L−1) in all seasons. Pb concentrations ranged from 0.106 to 0.38 mg L−1, Cd from 0.025 to 0.065 mg L−1, Cu from 0.12 to 0.57 mg L−1, and Zn from 0.72 to 1.76 mg L−1; all exceeded the standard permissible limits throughout the study period. The physicochemical properties of water at S3 are shown in Table 4. Temperature (WT) fluctuated from 13 oC in winter to 21 oC in both autumn and summer, surpassing the reference value (15 oC) in autumn and summer. The water samples turbidity was recorded between 11.55 and 12.8 NTU, which was higher than the standard limit value (5 NTU) for all seasons. EC levels fluctuated between 678 and 1150 µS cm−1 , and crossed the maximum permissible limit (1000 µS cm−1) in summer alone. TDS values ranged from 334 mg L−1 to 585 mg L−1 and exceeded the allowable limit (500) in summer while below the limit in other seasons. The TSS was between 24.5 and 47 mg L−1 being in excess of the maximum permissible concentration of 25 mg L −1 during winter, spring and summer.
Table 4. Results of physicochemical water properties at site 3.
|
Variable |
Autumn |
Winter |
Spring |
Summer |
Standard Value (Sn) |
|
WT ( Cᵒ ) |
21 |
13 |
14.4 |
21 |
15 |
|
Tur. ( NTU ) |
12 |
12.8 |
11.55 |
12.1 |
5 |
|
EC ( µ.s . cm-1) |
698.5 |
707.5 |
678 |
1150 |
1000 |
|
TDS ( mg .L-1) |
417.5 |
365.5 |
334 |
585 |
500 |
|
Tss ( mg .L-1) |
24.5 |
47 |
30 |
30 |
25 |
|
DO ( mg .L-1) |
3.855 |
5.7 |
7.4 |
5.8 |
5.5 - 9 |
|
BOD ( mg .L-1) |
11.25 |
8.5 |
10.5 |
8.1 |
5 |
|
pH |
7.63 |
7.62 |
7.38 |
7.25 |
6.5 – 8.5 |
|
TA ( mg. CaCO3 . L-1) |
175.4 |
153.5 |
139.5 |
153 |
200 |
|
SO4 ( mg .L-1) |
160 |
165 |
162.5 |
324 |
250 |
|
NO3 ( mg .L-1) |
4.25 |
1.57 |
4.15 |
0.41 |
13 |
|
PO4 ( mg .L-1) |
0.44 |
0.66 |
0.535 |
0.37 |
0.1 |
|
TH ( mg .L-1) |
241.5 |
314 |
387.5 |
380 |
120 |
|
SiO2 ( mg .L-1) |
5.57 |
4.29 |
5.19 |
4.18 |
10 |
|
Pb ( mg .L-1) |
0.185 |
0.29 |
0.33 |
0.41 |
0.003 |
|
Cd ( mg .L-1) |
0.05 |
0.055 |
0.036 |
0.01 |
0.002 |
|
Cu ( mg .L-1) |
0.75 |
0.48 |
0.5 |
0.26 |
0.003 |
|
Zn ( mg .L-1) |
1.78 |
0.73 |
1.02 |
0.77 |
0.03 |
Concentration of DO was 3.855-7.4 mg L−1, which falls short of the WHO permissible limit (5.5–9 mg L−1 during autumn and within in standard limits under aseptic habitats in other seasons. BOD values varied from 8.1 to 11.25 mg L−1 and were above the standard (5mgL−1) in all seasons. The pH ranged from 7.25 to 7.63 and fell below the permissible level (6.5-8.5) in all seasons. The TA contents of the sampling fishing grounds varied from 139.5 to 175.4 mg CaCO3 L −1 and were lower than the standard value (200 mg CaCO3 L−1) in any season during this period. Sulfate (SO42−) concentration varied from 160 to 324 mg L−1 and overall exceeded the acceptable level (250 mg L−1) only in summer. Nitrate (NO3−) levels varied from 0.41 to 4.25 mg L−1 and were within the permissible level (<13 mg L−1) in all seasons. Phosphate (PO43−) concentrations varied between 0.37 and 0.66 mg L−1and all were above the guidelines value (0.1 mg L−1) throughout the year. TH fluctuated between 241.5 and 387.5 mg L−1 and was higher than the maximum permissible limit of (120mg L−1) during all seasons. SiO values oscillated between 4.18 and 5.57 mg L−1 but were always lower than the standard threshold of 10 mg L−1 in all tested seasons. Pb: 0.185-0.41 mg L−1 , Cd: 0.01-0.055 mg L−1 , Cu: 0.26-0.75 mg L −1, and Zn: all seasons exceeded the permissible standard values. The physicochemical properties of water at S4 (Table 5). Water temperature (WT) varied between 13.8 oC in winter and 21.6 oC in summer, and was above the norm (15 oC) during autumn and summer months. The range of turbidity per season was 7.6 to 12.7 NTU, and all were above the standard value (5 NTU). Electrical conductivity (EC) varied between 838 and 1180 µS cm−1, with a limit over the permissible level (1000 µS cm−1) at summer period. TDS concentrations varied from 427 to 720 mg L−1, and they were higher (500 mg L−1) than
the standard limit in the summer season only, being within permissible range during all other periods of time. TSS concentrations ranged from 27 to 41.5 mg L−1 and were higher than the 25 mg L−1 criterion during all seasons.
The physicochemical properties of water at S4 (Table 5). Water temperature (WT) varied between 13.8 °C in winter and 21.6 °C in summer, and was above the norm (15 ºC) during autumn and summer months. The range of turbidity per season was 7.6 to 12.7 NTU, and all were above the standard value (5 NTU). Electrical conductivity (EC) varied between 838 and 1180 µS cm⁻¹, with a limit over the permissible level (1000 µS cm⁻¹) at summer period. TDS concentrations varied from 427 to 720 mg L⁻¹, and they were higher (500 mg L⁻¹) than the standard limit in the summer season only, being within permissible range during all other periods of time. TSS concentrations ranged from 27 to 41.5 mg L⁻¹ and were higher than the 25 mg L⁻¹ criterion during all seasons. DO concentrations varied between 4.84 and 7.3 mg L⁻¹, and generally fell below the allowable DO range (5.5‐9 mg L⁻¹) during autumn, remaining in the standard range as applicable for other seasons. BOD values varied between 6.12-9.55 mg L⁻¹and higher than the standard limit of (5 mg L⁻¹) during all seasons. The pH of all the seasons, 7.03, 7.78 in different onion fields were found within safe limit (6.5–8.5). TA fluctuated seasonally from 135.5 to 190.6 mg CaCO₃ L⁻¹ and remained below the threshold value (>200 mg CaCO₃ L⁻¹) at all seasons. Sulfate (SO₄²⁻) levels varied between 172.5 and 348 mg L⁻¹ and violated the recommended threshold (250 mg L⁻¹) only during summer months. Nitrate (NO₃⁻) levels varied between 0.62 and 3.23 mg L⁻¹, falling below the acceptable limit (13 mg L⁻¹) at any season. PO₄³⁻ levels ranged from 0.18 to 0.79 mg L⁻¹ and were higher than the normal value (0.1 mg L⁻¹) in all seasons. TH varied between 324 and 390 mg L⁻¹ exceeding permissible limit (120 mg l⁻¹) in all the seasons. SiO₂ values were between 4.18 and 5.82 mg L⁻¹, which was in the normal range (10 mg L⁻¹) during all seasons. Season dependent, the concentrations of Pb = 0.10-0.38 mg L⁻¹, Cd = 0.02-0.046 mg L⁻¹, Cu = 0.29-0.65 mg L⁻¹, and Zn = 0.90-1.90 mg L⁻¹ were higher than those allowed for during all seasons by both the standards mentioned above; respectively. The lead (Pb) content ranged from 57 ± 9 to 571 ±46 μg g ⁻1, which was within the WHO permissible limit of <100 μg g ⁻1, except in one sample.
Table 5. Results of physicochemical water properties at site 4
|
Variable |
Autumn |
winter |
spring |
summer |
Standard Value (Sn) |
|
WT ( Cᵒ ) |
21 |
13.8 |
14.8 |
21.6 |
15 |
|
Tur. ( NTU ) |
9.5 |
8.25 |
12.7 |
7.6 |
5 |
|
EC ( µ.s . cm-1) |
855.5 |
848.5 |
838 |
1180 |
1000 |
|
TDS ( mg .L-1) |
427 |
432.5 |
450.5 |
720 |
500 |
|
Tss ( mg .L-1) |
31 |
41.5 |
34.5 |
27 |
25 |
|
DO ( mg .L-1) |
4.84 |
6.35 |
6.9 |
7.3 |
5.5 - 9 |
|
BOD ( mg .L-1) |
9.55 |
6.9 |
6.12 |
6.3 |
5 |
|
pH |
7.03 |
7.37 |
7.68 |
7.78 |
6.5 - 9 |
|
TA ( mg. CaCO3 . L-1) |
190.6 |
159 |
135.5 |
162 |
200 |
|
SO4 ( mg .L-1) |
193.5 |
7.3 |
172.5 |
348 |
250 |
|
NO3 ( mg .L-1) |
0.8 |
0.62 |
3.23 |
0.78 |
13 |
|
PO4 ( mg .L-1) |
0.595 |
0.79 |
0.465 |
0.18 |
0.1 |
|
TH ( mg .L-1) |
324 |
356 |
382.5 |
390 |
120 |
|
SiO2 ( mg .L-1) |
5.82 |
4.73 |
5.19 |
4.18 |
10 |
|
Pb ( mg .L-1) |
0.1 |
0.34 |
0.26 |
0.38 |
0.003 |
|
Cd ( mg .L-1) |
0.046 |
0.035 |
0.044 |
0.02 |
0.002 |
|
Cu ( mg .L-1) |
0.65 |
0.29 |
0.52 |
0.32 |
0.003 |
|
Zn ( mg .L-1) |
1.74 |
1.9 |
1.74 |
0.9 |
0.03 |
Water temperature is a fundamental physical variable that directly affects oxygen solubility, the rate of chemical reactions, and biological activity within aquatic systems, and it clearly reflects seasonal climatic variations [17]. The results of the study showed that water temperature at all four sites (S1–S4) reached its lowest values during winter (≈12–14 °C), while it rose during summer and autumn, exceeding the recommended standard values (15 °C) at most sites. This increase is attributed to higher atmospheric temperatures, increased solar radiation intensity, and reduced runoff rates, leading to faster heating of the water mass[18]. This thermal behavior was similar across the four sites, indicating that seasonal climatic factors are the primary influence on temperature variation, rather than spatial differences. Temperature exceeding the permissible limits during summer and autumn may contribute to reduced dissolved oxygen solubility and increased microbial activity, Seasonal elevations in water temperature are influence oxygen dynamics and microbial processes in aquatic systems[19]. Increasing. temperature lowers the solubility of oxygen in water, and hence leads to lower DO levels. At the same time, increased temperature results in higher microbial metabolic activity and enzymatic reaction rates, which promote biodegradation of organic matter. Such a phenomenon indicates that the oxygen-consuming activity of microorganisms is greater during this process. As a result, BOD increases and DO decreases. This inverse relationship is itself a key feature of aquatic biogeochemistry[20, 21]. The results of the present study agree with other studies [22-24]. This aligns with the study by Varol & Şen (2019), which demonstrated that summer increases in surface water temperature are closely linked to the deterioration of certain water quality indicators. However, these findings contradict those of Jia et al., which showed that water temperatures remain within acceptable limits in river systems with high flow and dense vegetation [25]. Turbidity is a measure of fine particles suspended in water that scatter and or absorb light [26]. All the sites have more turbidity values above the standards in most seasons, especially in S3 and S4 thus erosion of fine particles and surface runoff. This profile mirrors sustained physical stress. The result is in agreement with [27]. EC reflects the total dissolved salt concentration and is a direct indicator of ionic pollution [26]. EC values showed a marked increase at all sampling sites during the summer, exceeding permissible limits, particularly at sites S1 and S4. This increase is partly attributed to seasonal climatic conditions, as higher temperatures promote evaporation and reduce river discharge, leading to a concentration of dissolved ions[28]. However, the magnitude of the observed increase at specific sites suggests that climatic factors play a significant role. In addition to the proximity of some sampling sites to the Al-Dura refinery and power plant, the impact of human inputs must also be considered. Industrial waste is a known source of dissolved salts and ionic components that directly increase electrical conductivity[29]. Therefore, the spatial patterns of electrical conductivity likely reflect the combined effect of seasonal hydrological processes and local pollution sources. Similar observations have been recorded in river systems affected by industrial discharge, where changes in electrical conductivity are governed by evaporation dynamics and pollutant carrying.
TDS indicate the amount of total dissolved salts and minerals in the water [26]. The TDS values were above the permissible limits during the summer months at all stations, especially S3 and S4, because of high evaporation and concentration of salts. This increase can be partially explained by seasonal factors, as higher temperatures lead to increased evaporation rates and decreased river discharge, resulting in higher concentrations of dissolved ions [30]. However, the increases recorded at sites near sources of industrial activity suggest that climatic processes alone do not cause the increase observed in the current study. Industrial wastewater, particularly from oil refineries and power plants, is a known source of dissolved salts and inorganic ions that directly contribute to increased TDS [31, 32]. Therefore, the recorded spatial patterns likely reflect the combined influence of seasonal hydrological factors and human inputs related to industrial discharges. This interpretation is consistent with the general principles of water chemistry, where TDS is influenced by both physical concentration processes and external sources of ion loading [33]. TSS are suspended solid materials found in the water. Surface was found to have been active almost throughout the time in all but a few places, which recorded continuous exceedance (active surface runoff and erosion). The increment can be directly linked to an increased turbidity. The results agree with [34]. DO is an important measurement of aquatic system health and its capacity to support life [35, 36]. In S2, S3, and S4 DO decreased during the summer and autumn along with T (air) and BOD, reflecting substantial organic stress. The result is in agreement with [37]. BOD shows how much organic material is found in the water that can be broken down [38]. BOD above the threshold limits was recorded at all sites in most of the seasons, which showed that there is an organic pollution in the water that is coming from surface runoff. It agrees with [34]. pH is a key chemical variable that reflects the acidity or alkalinity of an aquatic environment. It directly affects the solubility of nutrients and heavy metals, as well as the biological activity of aquatic organisms [39]. The study results showed that pH values at all four sites (S1–S4) ranged from neutral to slightly alkaline and generally remained within the acceptable limits (6.5–8.5) throughout all seasons. This relative stability in pH values is attributed to the presence of natural buffer systems in the water, resulting from bicarbonates and carbonates, which limit sharp fluctuations in acidity despite seasonal variations. The similarity in pH values among the sites suggests that geological factors and the nature of the surrounding soil have a greater influence than local factors. However, this does not preclude the presence of pollution, especially given the high concentrations of phosphates and heavy metals recorded at the same sites[40]. These dissolved elements can remain bioavailable even within the acceptable pH range. These results are consistent with what the World Health Organization reported, which indicated that pH stability within the range (6.5–8.5) is common in surface waters, even in environments relatively affected by human activity [41].
Total alkalinity (TA) represents the water's ability to neutralize acids and reflects the presence of bicarbonates and carbonates. It also acts as a buffer system, maintaining pH stability [42]. The results from the four sites showed a marked increase in TA, particularly at site S1 during winter, while remaining relatively lower at the other sites. This suggests the influence of calcareous geological formations and seasonal runoff. The elevated TA reflects the dominance of natural processes rather than direct pollution; however, exceeding standard limits can affect the water's chemical properties. The geological characteristics of the Tigris River basin within the study area were considered primarily as a background environmental factor rather than a direct controlling variable[43]. The influence of sediment composition and riverbed structure on some hydrochemical properties can persist over longer time spans, but the observed changes in selected physical-chemical properties are likely to be linked with anthropogenic inputs. For regulated river systems, especially those that receive industrial and municipal releases, water quality dynamics are largely controlled not by the basin geology itself but by the availability of pollutants and their dilution potential (hydrological conditions), more than by factors related to season [44]. In addition, parameters such as EC and TDS are significantly affected by dissolved ionic load, which is brought in by wastewaters, industrial effluents, and surface run‑off. Likewise, turbidity and total suspended solids appear to be more closely associated with the discharge events, resuspension processes, and outside contribution than they are with the intrinsic geological homogeneity of a river basin [45]. As such, the geological formation is an important environmental context but does not in itself account for the spatial and temporal variability observed in this study. These findings are consistent with the study Kerr et al., which linked high alkalinity to the dissolution of carbonate rocks [46]. Heavy metals represent indicators of high environmental risk [47]. All the metals were higher than the standard in most of these sites, and seasonally, after autumn and winter, reveal a chronic heavy metal pollution situation. The increased levels of hazardous elements in the current study are largely attributed to oil refineries and power plants located near the study area. Failure to biologically treat these elements could harm humans, other living organisms, and the ecosystem [34]. This observation is in agreement with Ahmad et al [48].
Canadian Water Quality Index (WQI):
Table 6 shows the Canadian Water Quality Index (WQI) values at the four modeling sites during the current study period, based on the three index components: range (F1), frequency (F2), and intensity (F3), in addition to the sum of deviations (NSE), S1 showed F1 values of 66.66 and F2 values of 54.68, with a high sum of deviations of 9069.51 and an F3 value of 99.29, resulting in a WQI value of 24.07, classifying the water quality as Poor. At S2, F1 and F2 values were approximately 61.11 and 54.68, respectively, while the total deviation decreased to 1113.21 compared to site 1. The F3 value was 94.56, resulting in a WQI score of 27.73, with the water quality also classified as Poor. S3, however, recorded relatively higher values for the range factor F1 (77.77) and the frequency factor F2 (64.06), with a total deviation of 1280.25 and an F3 value of 95.23. This led to a WQI score of 19.91, maintaining the water quality classification as Poor. S4, the F1 value reached its highest level (100.70), while the F2 value reached approximately 64.06, and a total of deviations of 1252.17 was recorded, with the F3 value reaching 95.14. This resulted in the lowest WQI index value among the four sites, which was 11.89, indicating that the water quality was classified as Poor.
Table 6. Canadian Council of Ministers of the Environment Water Quality Index (WQI) values at the modeling sites during the current study period.
|
Sites |
F1 |
F2 |
Sum of Excursions |
NSE |
F3 |
WQI |
Water Quality Class |
|
S1 |
66.66 |
54.68 |
9069.51 |
141.71 |
99.29 |
24.07 |
Poor |
|
S2 |
61.11 |
54.68 |
1113.21 |
17.39 |
94.56 |
27.73 |
Poor |
|
S3 |
77.77 |
64.06 |
1280.25 |
20.00 |
95.23 |
19.91 |
Poor |
|
S4 |
100.70 |
64.06 |
1252.17 |
19.56 |
95.14 |
11.89 |
Poor |

Figure 2. Shows the locational variations in the values of the Canadian Water Quality Index (CCME) – WQI during the current study period.
The purpose of the Canadian Water Quality Index is to use a mathematical relationship to convert data from analyses of physical and chemical properties into simple values that provide an indicator of water quality [49]. The Water Quality Index values range from 0 to 100. The results of the Canadian Water Quality Index (CWI) values showed a difference between the study sites, with the highest value (27.73) recorded at S2 and the lowest value (11.89) at S4 (Table 6). The CWI results were consistent with the results of the physical and chemical factors for the study sites [50]. Low values were recorded in Tigris River Water due to the impact of sewage outlets, waste from various human activities cause water pollution, most notably the dumping of industrial waste containing toxic chemicals and heavy metals into rivers and lakes, as well as the discharge of untreated sewage that carries bacteria and viruses and reduces oxygen levels in the water[51]. Agricultural activity is also a polluter, as fertilisers and pesticides are washed into water courses by rainfall, leading to eutrophication[52]. In addition to the dumping of solid waste, such as plastics are also major contributors as well as oil spills in the process of extraction or transportation [53]. The CWI is a strong indicator of water usage duration and its impact on human activities [54]. High CWI values indicate good water quality, while low values indicate poor water quality, as a range of physical properties have contributed to this. The chemical values are low, such as high values for the biological oxygen demand, total hardness, dissolved salts, and other values [55]. According to the results of the current study, the water of Tigris River is of poor quality, as the water quality is always threatened or weak, and the water condition continuously deviates from the required or desired level.
Phenol values:
The seasonal and spatial patterns of the phenol concentration (mg L-1) at four stations are given in Table 7, which covers the study period from October 2024 to June 2025. There was obvious seasonality and site disparity for phenol at (P ≤ 0.05). Regarding season, the highest phenol seasonal average concentrations were observed in summer (1.55 mg L-1), followed by spring (1.39 mg L-1) and autumn (1.1925 mg L-1), and the lowest was observed in winter (1.015 mg L-1). In terms of spatial variation, the highest overall average phenol concentration of 1.80 mg L-1 was obtained on S2 followed by S4 (1.528 mg L-1), then by S3 (1.105 mg L-1), and lowest with respect to average phenol content was recorded at S1 (0.715 mg L-1).
Table 7: Seasonal and locational variations of Phenol values (mg L -1) at the current study site for the period from October 2024 to June 2025.
|
Seasons |
S1 |
S2 |
S3 |
S4 |
Seasonal Mean |
|
Autumn |
0.51 |
1.54 |
1.20 |
1.52 |
1.1925 |
|
Winter |
0.68 |
1.08 |
1.00 |
1.30 |
1.015 |
|
Spring |
0.88 |
2.28 |
0.88 |
1.52 |
1.39 |
|
Summer |
0.79 |
2.30 |
1.34 |
1.77 |
1.55 |
|
Site Mean |
0.715 |
1.80 |
1.105 |
1.528 |
— |
|
LSD P≤ 0.05 |
|||||
Phenolic compounds are a group of organic compounds containing a benzene ring attached to a hydroxyl group (-OH). Their presence in water is an important indicator of organic pollution, as they are often associated with industrial waste (such as from refineries, the oil industry, plastics, and dyes), sewage discharge, decomposition of plant organic matter, and runoff from agricultural lands and urban areas[56]. Considerable seasonal and spatial variations were observed in phenol concentrations at the studied sites. Phenol concentrations were higher in summer than winter seasons. This distribution results are in line with those by Otitoju et al. [57], and Du et al. [58], who concluded that higher summer temperatures promote microbial activity and decomposition of organic matter, with greater release of phenolic compounds. On the other hand winter usually brings heavy rains and water flow, which would induce dissolution effects, leading to lower concentration of phenols [59].
Oils values:
Table 8 shows seasonal and locational variations of oil values (mg L-1) at the current study site for the period from October 2024 to June 2025. The results of statistical analysis showed that the oil concentration varied significantly with seasons and sites at P ≤ 0.05. Seasonal The highest mean for seasonal oil concentrations was shown in summer (3.5675 mg L-1), the next were spring (2.47 mg L-1), and autumn (2.3925 mg L-1), and the lowest values were recorded at winter (1.9175 mg L-1). During the winter period, oil contents varied from 0.30 mg L-1 it S1 to 4.94 mg L-1 at S2 in summer, the highest average oil concentration (3.435 mg L-1) was observed in S2, followed by S4 (3.47 mg L-1) and S3(3.003 mg L-1), while the lowest mean value was recorded at S1(0.44 mg L -1). The oil concentrations at S1 were all considerably lower than those measured at the other sites in all of the seasons.
Table 8. Seasonal and locational variations of oil values (mg/L) at the current study site for the period from October 2024 to June 2025.
|
Seasons |
S1 |
S2 |
S3 |
S4 |
Seasonal Mean |
|
Autumn |
0.35 |
3.11 |
2.90 |
3.21 |
2.3925 |
|
Winter |
0.30 |
2.57 |
2.10 |
2.70 |
1.9175 |
|
Spring |
0.36 |
3.12 |
3.00 |
3.40 |
2.47 |
|
Summer |
0.75 |
4.94 |
4.01 |
4.57 |
3.5675 |
|
Site Mean |
0.44 |
3.435 |
3.003 |
3.47 |
— |
|
LSD P≤ 0.05 |
|||||
Oil and grease compounds are considered important indicators of hydrocarbon pollution in aquatic environments. Their presence in surface waters is mainly attributed to anthropogenic activities such as petroleum-related operations, urban runoff, sewage effluents, and agricultural practices, in addition to natural inputs from organic matter decomposition [60]. In the current study, the oil content had significant seasonal and spatial variations among the two sites during the sampling years. During the seasons the trend for oil concentrations was that it was highest during summer and lowest in winter. This seasonal trend is consistent with those reported by Elmorsi et al., [60] and Murtaza et al., [61], who showed that higher temperatures in summer may increase oil solubility, evaporate lighter components, and lead to increased human activities with higher oil residues at the water surface temperatures, on the other hand, can be associated with growth and subsequent accumulation of oil since low winter water concentrations may show an increase in rainfall and flow-rate which causes dilution and spreading of the oil-contaminated type. In spatial distribution, S2 and S4 had relatively high oil concentrations throughout the periods among sampling sites while S1 was low oil concentration in any season. The same spatial patterns reported Hossain et al. [62] who linked higher concentrations of oil to nearness to urban discharges, transportation activities, and to places exposed to intense anthropogenic pressure. Relatively low concentrations detected at S1 may be evidence for few direct sources of pollution on this site and a high potential for self-purification. Nonetheless, findings of the current study disagree to some extent with those since Samanta et al. [63], who recorded little seasonal fluctuation in oil level because of the continued loading operations for industrial needs that occur year round. This difference indicates that, in the current study area, oil pollution is dependent on seasonal environmental conditions and different human activities, as opposed to continuous point-source discharges.
4. Conclusion:
The current study reveals a marked seasonal and spatial decline in the water quality of the Tigris River at the studied locations. Some physicochemical parameters, nutrients, and heavy metals exceeded international guideline values thus, a few organic matter, nutrient, and metal pollution pressures are continuous. High levels of phenols and oil-related compounds, especially in the summer, are a clear indication of the heavy influence of industrial and urban activities located close to the studied sites. The CCME-WQI classification in general verifies that the water quality of this part of the Tigris River is not suitable and further emphasizes on essential for routine monitoring and proper pollution control.